Most factories know their machines are not running as much as they should. Few know exactly how much time is lost, when, and why. OEE (Overall Equipment Effectiveness) and machine monitoring software turns that into numbers: live status for every machine, downtime by reason, speed losses and rejects, and the OEE that combines them. If you need a refresher on the metric, read what is OEE and how to calculate it.
This guide is for manufacturers considering custom OEE and machine monitoring software development. It covers how data is captured, how the system is designed, how to roll it out, and what drives cost.
What a monitoring system does
- Live status — running, idle, stopped, in setup, or alarm, for each machine.
- Counts — parts produced against target, by shift, order and product.
- Downtime — every stop with start, end and reason.
- Quality — rejects and rework by reason.
- OEE — availability × performance × quality, by machine, line, shift and product.
- Alerts — notifications when a machine stops for longer than a set time or a target is missed.
- Andon boards — large screens on the shop floor showing status and progress.
- Analysis — top losses (see the six big losses), trends and comparisons.
Data capture: four levels
Level 1: Operator entry
Operators record start, stop, counts, reasons and rejects on a tablet. Quick to start on any machine, but run time and counts depend on discipline.
Level 2: Simple signals
A current sensor on the spindle motor, a cycle switch, a stack light tap or a counter output tells the system when the machine runs and how many cycles it completes. This works on almost any machine, including old ones. See retrofitting old machines for IIoT.
Level 3: Controller and PLC data
Many modern CNC controllers and PLCs can provide status, part counts, program numbers, alarms, feeds and spindle load through their data interfaces or industrial protocols, where the machine and its options support it. This gives rich data without additional sensors.
Level 4: Process parameters
Temperatures, pressures, cycle parameters and energy consumption for process monitoring, quality analysis and predictive maintenance.
A practical system mixes levels by machine, and always lets operators add the reason for a stop — no sensor knows that the machine stopped because material didn't arrive.
Architecture
- Edge devices — small gateways at the plant read sensors and controllers, buffer data during network outages, and send it to the server.
- Server — cloud or on-premise, storing events and calculating status, OEE and reports.
- Operator tablets — at machines or lines for reasons, rejects and job selection.
- Dashboards — web dashboards for supervisors and managers, mobile alerts, and TV screens on the floor.
- Integration — production orders from the MES or ERP; results back to them.
Designing downtime reasons
The value of monitoring depends on the quality of downtime reasons. Keep the list short per machine type, organise it by category (breakdown, setup, material, manpower, quality, planned), prompt for the reason when the stop occurs, and review uncoded downtime daily. Our guide on designing downtime reason codes covers this in detail.
Defining OEE consistently
Agree the definitions before building: what counts as planned time (are breaks and planned maintenance excluded?), what ideal cycle time is used for each product, how rework is treated, and how micro-stops are handled. Different definitions make OEE numbers incomparable between machines and plants. Read what is a good OEE score before setting targets.
Rollout
- Pilot on a few machines — choose a bottleneck and machines of different types.
- Validate the data — compare signal counts with actual output; adjust thresholds for idle and running.
- Train supervisors and operators on reasons and the daily review.
- Start daily loss meetings with the top three losses from yesterday.
- Extend to more machines and lines, then add alerts, andon boards and integration.
What drives development cost
- Number and variety of machines — each controller type or sensor approach needs setup and testing.
- Hardware — sensors, gateways, tablets, screens and network.
- Level of data — status and counts versus process parameters.
- Dashboards, reports and alerts required.
- Integration with MES, ERP and maintenance.
- On-premise versus cloud hosting.
Common pitfalls
- Installing sensors without a process to act on the data.
- Too many downtime reasons, so operators choose "others".
- Comparing OEE across machines with different definitions.
- Ignoring planned production time, so idle machines appear as losses.
- No owner for the daily review.
What success looks like
Within weeks, supervisors know which machines lost the most time yesterday and why; maintenance sees breakdown patterns; planners use real cycle times; and management reviews the same numbers as the shop floor. Improvement comes from acting on that data — the software makes the losses visible.
A worked example: a CNC machining company
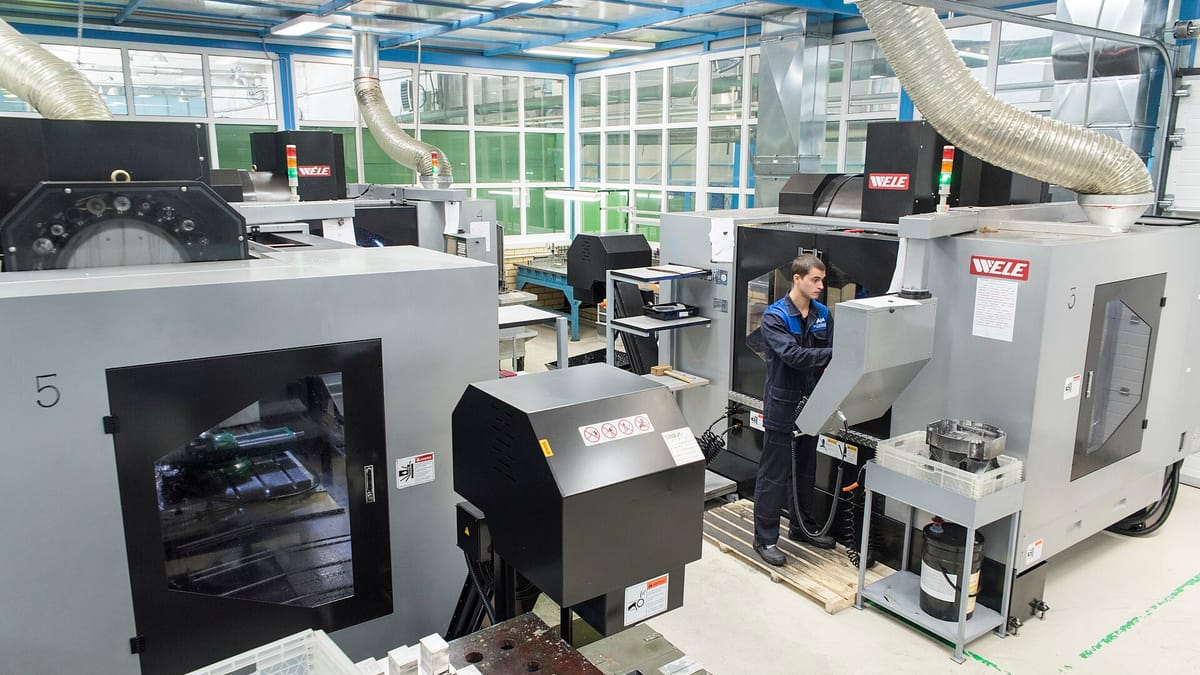
A precision machining company with 40 CNC machines of different makes and ages wanted to understand why delivery performance lagged although machine "efficiency" on shift reports was above 80%. A monitoring system was introduced in stages: running signals from current sensors on older machines, controller data on the newer ones, and a tablet per machine group for reasons and rejects.
Within the first month, the data showed that machines were running far less than the shift reports suggested. The largest losses were waiting for first-off approval from quality, waiting for programmes and tools after a setup, and long changeovers on a few high-mix machines. None of these were recorded on paper. The improvement actions were organisational — a quality inspector assigned to setups during peak hours, tool kits prepared before changeovers — and cost little. The monitoring system made the losses visible; the people fixed them.
Choosing hardware
- Current sensors — non-invasive clamps on a motor feed; good for run/idle and rough load. Need an electrician for installation.
- Digital inputs — cycle-complete or stack-light signals into an I/O module; good for counts and status.
- Controller connectivity — no extra sensors, richer data; depends on controller make, model and options.
- Gateways — industrial-grade, fanless, with local buffering; one per area or line.
- Tablets — rugged cases and fixed mounts near the operator's position.
- Screens — TV screens with a small computer or stick for andon boards.
- Network — reliable Wi-Fi or wired Ethernet on the shop floor; often the hidden prerequisite.
Reports that drive improvement
- Machine timeline — a coloured bar per machine showing run, idle, setup and down periods through the shift.
- Loss Pareto — minutes lost by reason, per machine and line.
- OEE trend — weekly by machine and line, with availability, performance and quality.
- Shift comparison — same machines, different shifts.
- Cycle time analysis — actual against ideal by product, to correct standards.
Working with Corposol
Corposol is a manufacturing software development company founded in 2018 in Bengaluru, India, with a US company, Corposol LLC, in Montana. We build OEE and machine monitoring software as cloud web applications with Android and iOS apps where they help, connect them to the systems you already use where those systems allow it, deliver in phases, and transfer all custom code to you on final payment. If you are planning a project, we are happy to walk through your current process and suggest a sensible first phase.
Frequently asked questions
Do we need new machines to monitor OEE?
No. Older machines can be monitored with add-on sensors such as current sensors or cycle switches, or with operator entry on a tablet. Newer CNCs and PLC-controlled machines can often share data through their controllers, where the machine supports it.
How accurate is OEE from operator entry alone?
It is useful for downtime reasons and quality, but run time and counts tend to be approximate. Automatic signals make availability and performance accurate, while operators add reasons and rejections. Most factories combine both.
What does a machine monitoring system show?
Live machine status, counts against target, downtime with reasons, OEE by machine, shift and product, top losses, and trends. Large screens on the shop floor show the same data as managers see on their phones.
Can monitoring data feed our MES or ERP?
Yes. Counts and downtime can update production orders in an MES, and summaries can go to an ERP or reporting system, where those systems allow it.