Once a factory starts measuring OEE, the next question is always "is our number good?" The answer depends on the type of manufacturing, how OEE is defined, and where you started. This guide explains the common benchmarks, why they are often misused, and how to set targets that lead to real improvement.
The 85% "world-class" benchmark
The most widely quoted benchmark is that world-class OEE is about 85%, often broken down as roughly 90% availability, 95% performance and 99.9% quality. The figure originates from early TPM literature describing high-volume, dedicated production lines.
It is a useful reference point, but treat it carefully:
- It reflects dedicated, high-volume lines, not job shops with many short runs.
- It assumes consistent definitions — what counts as planned time, which ideal cycle time is used.
- Many factories that start measuring honestly find figures far lower — commonly quoted ranges for plants that have just started measuring are around 40% to 60%. That is normal and is the starting point, not a failure.
Context by type of manufacturing
| Type | Characteristics | What drives OEE |
|---|---|---|
| High-volume dedicated lines | Few products, long runs | Breakdowns, small stops, speed |
| Batch production | Product changes, cleaning, recipes | Changeovers, cleaning, start-up losses |
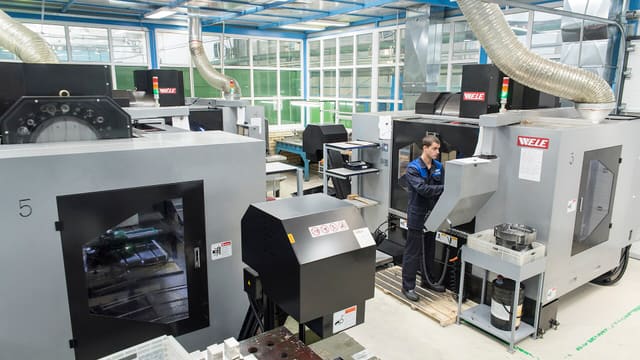
| Job shops and CNC machining | Many parts, small lots, frequent setups | Setups, programme proving, first-off approval |
| Process industries | Continuous flow | Rate losses, grade changes, unplanned shutdowns |
A job shop with 60% OEE may be performing better relative to its potential than a dedicated line at 75%. Compare like with like.
Definitions change the number
Two factories with identical performance can report very different OEE because of definitions. Agree and document:
- Planned production time — are breaks, meetings, planned maintenance and "no orders" time excluded?
- Ideal cycle time — the machine's design rate, the best demonstrated rate, or the costing standard? Using a slow standard inflates performance.
- Setup — availability loss, or excluded as planned?
- Rework — counted as good or as a quality loss?
- Small stops — counted as availability or performance loss?
The commonly used convention counts setups as availability loss, uses the best demonstrated or design cycle time, and counts rework as quality loss. Whatever you choose, apply it the same way across machines and plants.
Beyond OEE: TEEP and utilisation
TEEP (Total Effective Equipment Performance) measures productive time against all calendar time, including unscheduled shifts. It answers a different question: how much more could this machine produce if we ran it more? Useful for capacity decisions; OEE is better for day-to-day improvement.
Setting realistic targets
- Measure a baseline for four to six weeks with reliable data, ideally from machine signals.
- Break it down into availability, performance and quality and the six big losses.
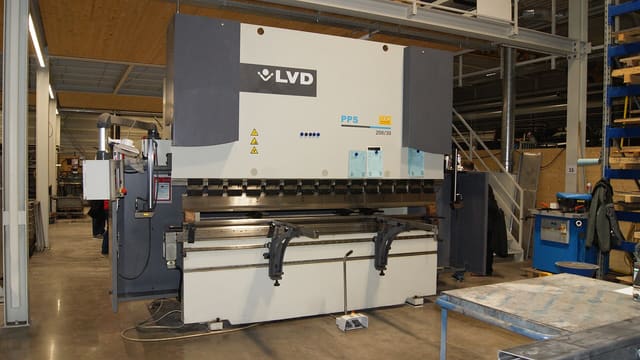
- Pick the largest loss on the bottleneck and target it specifically — for example "reduce average setup on Press 3 from 45 to 30 minutes".
- Set an OEE improvement target relative to the baseline, such as a few percentage points per quarter, rather than jumping to 85%.
- Review and reset each quarter.
When a high OEE is misleading
- Ideal cycle times set too slow.
- Planned time excluding real losses such as waiting for material.
- Operators not recording rejects or short stops.
- High OEE on a non-bottleneck machine that is producing inventory nobody needs.
OEE is a tool for finding losses, not a score to maximise for its own sake. The bottleneck's OEE matters most, because it determines what the factory can ship.
Getting reliable OEE data
Manual OEE calculated from shift reports is a good start but tends to overstate performance and miss small stops. Automatic run signals and counts from machine monitoring, combined with operator-entered reasons and rejects, give a trustworthy number. See OEE and machine monitoring software development.
Example: two machines, two different stories
Machine A, a dedicated press running one part all day, shows 78% OEE. Machine B, a CNC machining centre running eight different parts per shift, shows 55%. A manager comparing the two might push Machine B's team harder. But Machine B's losses are mostly setups that its product mix requires, and its OEE has risen from 42% to 55% in a quarter through SMED and better job sequencing. Machine A has been flat at 78% for a year, with small stops as the main loss. Both have useful improvement opportunities — but they are different, and the absolute numbers alone would have hidden that.
Breaking OEE down for targets
Setting a target on the OEE total is less useful than targets on its components:
- Availability — targets for breakdown hours and average setup time.
- Performance — targets for speed relative to ideal cycle time, and for small stops.
- Quality — targets for first-pass yield and start-up rejects.
Each component points to a team and an action, so targets become a plan rather than a number on a wall.
How to present OEE to the shop floor
- Show the current shift's progress against target on a screen near the line.
- Show yesterday's top three losses in minutes, not just percentages.
- Celebrate improvement against the team's own baseline.
- Avoid league tables between operators or shifts that encourage poor data.
Frequently asked questions
Is 85% OEE realistic for a small factory?
For high-volume, dedicated lines it can be a long-term goal. For job shops with frequent changeovers and small batches, much lower figures can represent good performance. Compare yourself with your own baseline first.
Why is our OEE lower than our efficiency figure?
Efficiency figures often ignore some losses — for example comparing output with a standard time that already includes allowances, or excluding setups. OEE uses ideal cycle time and planned production time, so it exposes more losses.
Should OEE be used to compare operators?
Generally no. OEE is a measure of the equipment and process, and most losses are outside an operator's control. Using it to blame individuals encourages poor data.
How often should OEE be reviewed?
Daily at shift or line level for action, weekly for trends, and monthly for management review and targets.