
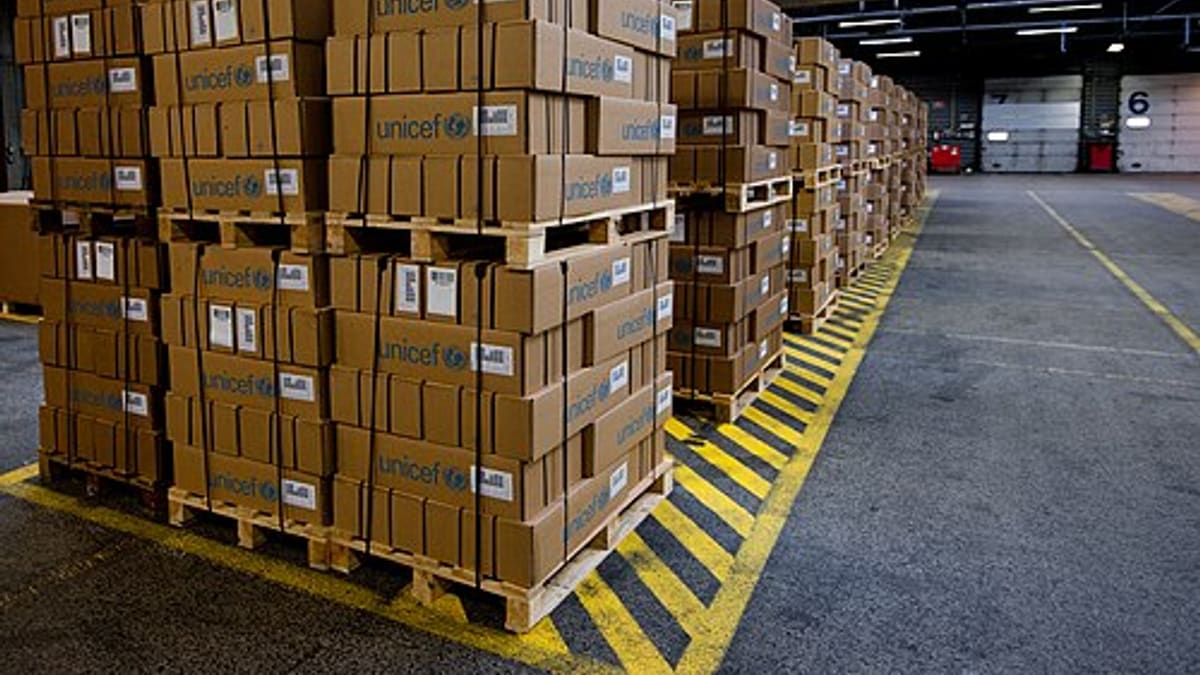
A typical factory store holds hundreds or thousands of different items. Giving every item the same attention is impossible — and unnecessary. ABC analysis, based on the Pareto principle, identifies the few items that account for most of the value so you can focus effort where it pays back.
The principle
In most inventories, a small percentage of items accounts for a large share of consumption value. Commonly:
- A items: around 10–20% of items, around 70–80% of value.
- B items: around 20–30% of items, around 15–20% of value.
- C items: around 50–70% of items, around 5–10% of value.
The exact split varies; the pattern rarely does.
How to do ABC analysis
- List all items with annual consumption quantity and unit cost.
- Calculate annual consumption value = quantity × unit cost.
- Sort items by consumption value, highest first.
- Calculate each item's percentage of total value and the cumulative percentage.
- Assign classes: A until cumulative reaches about 75–80%, B until about 95%, C for the rest.
How to use ABC classes
A items: tight control
- Frequent review of stock levels and forecasts.
- Lower safety stock, more frequent orders.
- Close supplier relationships and negotiated prices.
- Frequent cycle counts (monthly or more often).
B items: moderate control
- Regular review, standard reorder levels.
- Quarterly cycle counts.
C items: simple control
- Generous safety stock, infrequent large orders.
- Simple two-bin or min-max systems.
- Annual or half-yearly counts.
Adding XYZ: demand variability
XYZ analysis classifies items by how steady their demand is: X (stable), Y (fluctuating), Z (erratic). Combining ABC and XYZ gives nine groups. AX items (high value, steady) are ideal for lean, frequent replenishment. AZ items (high value, erratic) need careful planning and close collaboration with sales or production. CZ items might be ordered only on demand.
Adding criticality: VED for spares
For maintenance spares, value alone is misleading — a cheap seal can stop a line. VED classification (vital, essential, desirable) adds criticality. A vital C-class spare still deserves guaranteed stock. See spare parts criticality.
ABC and cycle counting
ABC classes set counting frequency: count A items often, C items rarely. This focuses counting effort on the items where errors cost most, and keeps overall stock accuracy high without full shutdowns for annual stock takes. See cycle counting.
ABC and warehouse layout
A separate analysis by pick frequency (rather than value) helps layout: fast-moving items near dispatch and at convenient heights; slow movers further away. See bin location setup.
ABC for purchasing focus
A items are where negotiation, alternate suppliers and price reviews have the biggest impact. Purchase teams should spend their time there rather than chasing small savings on C items.
Common mistakes
- Classifying by unit price instead of consumption value.
- Doing the analysis once and never updating it.
- Ignoring criticality for spares.
- Treating C items as unimportant — stock-outs of C items can still stop production.
How software helps
Inventory software calculates consumption value from issue history, classifies items automatically, refreshes classes periodically and uses them in reorder policies, counting schedules and reports. See inventory management software.
Talk to us about bringing ABC-based control to your stores.
A worked example
Imagine a store with 1,000 items and an annual consumption value of 10 million (in any currency). After sorting, the top 120 items account for 7.6 million — 76% of value. These become A items. The next 230 items add 1.8 million, bringing the cumulative share to 94%; these are B items. The remaining 650 items account for just 0.6 million, or 6% of value — C items. In practice, this means the purchase and planning team should spend most of its attention on 120 items, not 1,000.
When the team reviewed the A items in such an exercise, they would typically find opportunities quickly: a few items with excessive safety stock, some with outdated prices that could be renegotiated, and a handful bought from a single supplier with no alternative. Each of these represents real money, and none would have stood out in an unsorted list of 1,000 items.
Presenting ABC results to management
A simple chart — cumulative value against cumulative number of items — shows the Pareto curve clearly and makes the case for differentiated control. Pair it with current stock value by class: if C items hold a surprisingly large share of stock value, policies for them may be too generous; if A items show frequent stock-outs, their policies may be too tight.
Combining ABC with lead time
Lead time adds another useful dimension. An A item with a two-day local lead time can be managed with very little stock; an A item imported with a three-month lead time needs careful forecasting and buffer. Grouping A items by lead time helps planners decide where forecasting effort and supplier development matter most.
Getting started
Export one year of issue history with item costs, run the classification, and agree policies for each class with stores, purchase and planning. Then build the classes into your inventory system so reorder levels, counting cycles and reports use them automatically. Review classes every quarter — new products, discontinued items and price changes all shift items between classes over time.
Frequently asked questions
Is ABC analysis based on price or consumption value?
Consumption value — unit cost × annual usage. A cheap item used in huge quantities can be an A item.
How often should ABC classes be updated?
Quarterly or half-yearly, as consumption patterns change.
Should C items be ignored?
No, but they can be managed with simpler rules — generous safety stock, infrequent review — because their total value is small.
What is XYZ analysis?
A classification by demand variability: X steady, Y variable, Z erratic. Combined with ABC it shows which high-value items are hard to forecast.
Can software classify items automatically?
Yes. Inventory software can calculate consumption value and assign ABC classes automatically, and use them in reports and counting schedules.


