
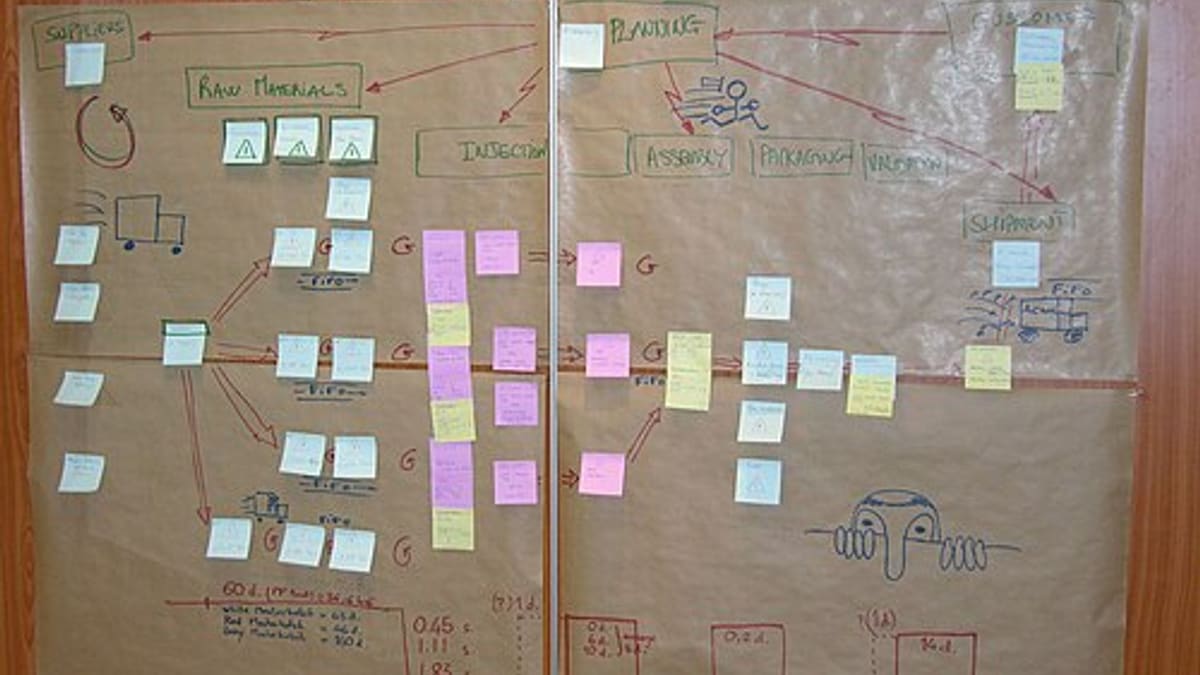
Ask a factory how long it takes to make a product and you'll often hear the machine time: "about two hours". Ask how long it takes from receiving an order to shipping it, and the answer might be three or four weeks. The gap between those numbers is where most improvement opportunity lies — and value stream mapping (VSM) is the tool that makes it visible.
What a value stream map shows
A value stream map is a one-page picture of how a product family flows through the factory, showing:
- Each process step, with key data: cycle time, changeover time, uptime, number of operators, batch size, scrap rate.
- Inventory between steps — how much material is waiting and for how long.
- How material moves: pushed by a schedule or pulled by the next step.
- The information flow: how orders, forecasts and schedules reach each process.
- A timeline comparing total lead time with value-adding processing time.
Step 1: Choose a product family
Don't map the whole factory. Pick a product family — products that pass through similar process steps and equipment. Choose one that matters: high volume, long lead time, customer complaints or strategic importance. A simple matrix of products against process steps helps identify families.
Step 2: Form a team
Include people from production, planning, quality, stores and, ideally, sales or customer service. A cross-functional team sees the whole flow, not just their part. A facilitator who knows the method keeps the exercise focused.
Step 3: Start at the customer
Record customer demand: how many units per day or week, how many variants, order patterns and delivery requirements. Calculate takt time — available time divided by demand — as a reference for the pace the process should achieve.
Step 4: Walk the process
Walk the actual path of the product, ideally from dispatch backwards to receiving, so you stay focused on the customer. At each step, observe and record:
- Cycle time — how long one unit or batch takes.
- Changeover time.
- Uptime or availability.
- Operators and shifts.
- Batch sizes.
- Scrap and rework.
Use observed data where possible rather than standard times from the system — the purpose is to see reality.
Step 5: Count inventory
Between each step, count the material waiting: raw material, WIP, finished goods. Convert each quantity into days of demand — 2,000 parts waiting with demand of 500 per day is 4 days. These waiting times usually make up most of the lead time.
Step 6: Map the information flow
How does each process know what to make? Draw the flow of orders from the customer, forecasts, the planning system, schedules sent to each department, and the informal channels — expediting calls, supervisors' lists, WhatsApp messages. Many plants discover that several processes are scheduled independently, which causes inventory to pile up between them.
Step 7: Draw the timeline
Along the bottom of the map, draw the timeline: waiting time at each inventory point and processing time at each step. Add them up. Typically, total lead time is measured in days or weeks while processing time is minutes or hours. That ratio is usually a shock — and a powerful motivator.
Step 8: Design the future state
Ask a set of questions to design a better flow:
- What is the takt time, and can the bottleneck meet it?
- Where can we create continuous flow between steps, removing inventory?
- Where flow isn't possible, can we use kanban or FIFO lanes to control inventory?
- Which single point should receive the schedule — the pacemaker process?
- How can we level the mix and volume at the pacemaker?
- What improvements — changeover reduction, uptime, quality — are needed to make this work?
Draw the future-state map with these changes and estimate the new lead time.
Step 9: Build the action plan
Turn the gap between current and future state into a list of projects with owners, dates and measures — for example, reducing changeover time on the press, creating a FIFO lane between welding and painting, moving scheduling to the assembly line only. Review progress regularly, and update the map as changes take effect.
An example
A manufacturer of steel enclosures mapped its best-selling family. The current state showed a lead time of about eighteen days, with under three hours of actual processing. Large batches at the punching machine, a week of WIP before powder coating and separate schedules for every department were the main causes. The future state introduced smaller punching batches enabled by faster changeovers, a FIFO lane before painting and a single schedule at assembly with kanban pulling from fabrication. Within a year, lead time for the family fell to around eight days and WIP roughly halved.
Common mistakes
- Mapping the whole factory instead of one family.
- Drawing the map in a meeting room from memory.
- Using system standard times instead of observing reality.
- Ignoring the information flow.
- Producing a beautiful future state with no action plan.
How software helps
Real-time production and WIP data make value stream maps faster to draw and easier to keep current: cycle times, changeovers, uptime, scrap, and inventory at each stage are available without stopwatch studies. See MES software and our WIP tracking guide.
Talk to us about getting the data your value stream maps need.
Frequently asked questions
What is a value stream?
All the steps — value-adding and not — needed to bring a product from customer order or raw material to delivery, including the information flow that triggers each step.
How long does a value stream mapping exercise take?
For a single product family in a small or mid-sized plant, the current-state map can often be drawn in a day or two of walking and discussion, with the future state and plan in another day.
Do we need special software to draw a value stream map?
No. Paper, a large sheet and sticky notes work well, and many teams prefer them for the first maps. Digital tools help when maps must be shared and updated.
What is the difference between lead time and processing time?
Processing time is the time the product is actually being worked on. Lead time is the total elapsed time from start to finish, including waiting. In most factories, waiting dominates.
How often should we redo the map?
After the planned improvements are in place — often six to twelve months later — draw a new current state and start the next cycle.


