Technicians are the face of a service business. Their productivity, skill and attitude determine customer satisfaction and profitability. Measuring technician performance helps managers coach, recognise good work and spot problems early. But poorly chosen or unfairly measured KPIs damage morale and encourage the wrong behaviour. Here's a balanced approach.
Productivity KPIs
Jobs completed per day
A simple measure of output, but it must be compared within similar job types — five preventive visits are not equivalent to five complex repairs.
Utilisation
Time on jobs as a share of available working time. Low utilisation may reflect poor scheduling or long travel rather than the technician's effort.
Travel time
Time between jobs. High travel usually points to dispatch and territory issues.
Quality KPIs
First-time fix rate
Jobs resolved on the first visit. A strong indicator of skill, preparation and parts management. See improving first-time fix.
Repeat visits (callbacks)
Jobs where the same problem returns within a defined period. High callbacks suggest incomplete repairs or misdiagnosis.
Checklist completion and report quality
Whether checklists, readings and photos are complete. Good documentation supports customers and renewals.
Customer KPIs
Customer ratings
Ratings and comments after jobs reflect punctuality, communication, cleanliness and outcome.
Complaints
Complaints linked to the technician, investigated fairly.
Responsiveness KPIs
Response time
Time from assignment to arrival, especially for urgent jobs.
Punctuality
Arrival within the promised time window.
Commercial KPIs
Quotes raised and converted
Technicians who identify and explain additional work help customers and grow revenue.
Parts usage accuracy
Parts recorded against jobs versus van stock movements.
Safety KPIs
Safety checklist completion, incidents and near misses. Safety must never be traded for productivity.
Measuring fairly
- Compare technicians doing similar work in similar territories.
- Use enough data — weeks or months, not single days.
- Exclude factors outside the technician's control where possible.
- Share definitions so technicians understand how they're measured.
Using KPIs for coaching
KPIs are most valuable in regular one-to-one conversations: celebrating strengths, discussing specific jobs, identifying training needs and agreeing goals. Technicians who see their own data — on their app — often improve without being asked.
Incentives
Incentives linked to a balanced set of KPIs — productivity, quality, customer ratings and safety — encourage the right behaviour. Incentives on jobs per day alone can encourage rushing and lower quality.
How software helps
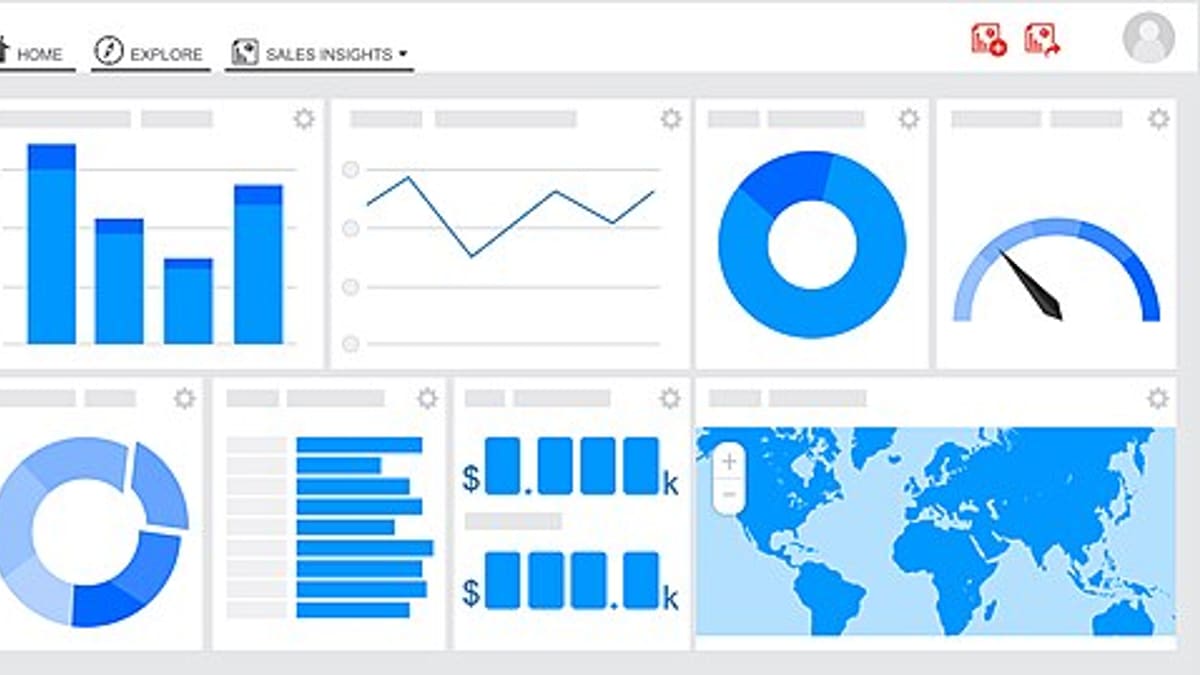
Field service software captures the data behind every KPI automatically — check-ins, job times, travel, parts, checklists, ratings — and presents dashboards for managers and technicians. See field service management software.
Talk to us about technician performance dashboards.
A balanced scorecard example
A service company combines five measures into a monthly technician scorecard: first-time fix rate, customer rating, jobs completed relative to the team average for similar job types, checklist and report completeness, and safety compliance. Each measure carries a weight, and the scorecard is shared with technicians in the app. Monthly coaching conversations focus on one strength and one improvement area. Incentives are tied to the overall score, with a minimum safety requirement. Over time, the company sees improvements in quality metrics without the rushed work that came from rewarding job counts alone.
New technicians and ramp-up
New technicians naturally perform below experienced colleagues for a while. Tracking their KPIs against a ramp-up plan — with expected improvement over weeks and months — gives managers an objective view of progress and helps identify where extra training or mentoring is needed.
Team-level KPIs
Some outcomes depend on the whole system, not just individuals: dispatch quality, parts availability, information from customers. Team-level KPIs — region, branch or shift — encourage collaboration and highlight process problems that individual metrics can hide.
Frequently asked questions
Should technicians be compared directly?
Only with care. Different job types, territories and equipment affect results. Compare like with like and use data for coaching, not just ranking.
Which KPI matters most?
It depends on your business, but first-time fix and customer satisfaction are often the most important indicators of quality.
Can technicians see their own KPIs?
Yes, and they should. Transparency motivates improvement and builds trust in the data.
How do we measure utilisation?
Productive time on jobs divided by available working time, using check-in, check-out and travel data.
Should incentives be linked to KPIs?
Often yes, but balance productivity with quality and safety so incentives don't encourage rushed work.
How often should KPIs be reviewed?
Weekly for operational metrics, monthly for coaching conversations and quarterly for broader reviews.
Can new technicians be tracked against a ramp-up plan?
Yes. New technicians' KPIs are compared with expected progress over their first weeks and months, highlighting where extra training or mentoring is needed.
Should team-level KPIs be used too?
Yes. Some outcomes depend on dispatch, parts and information from customers, so team or region KPIs encourage collaboration and reveal process problems.
Can KPIs be shown to technicians on their phones?
Yes. Technicians see their own scorecards — jobs, first-time fix, ratings and checklist completeness — in the app, which encourages self-improvement and makes coaching conversations more constructive.
How do we avoid KPIs encouraging rushed work?
Balance productivity measures with quality, customer and safety measures, and set minimum safety requirements before any incentive applies.
Can travel time be separated from job time?
Yes. Check-ins and check-outs separate time on site from travel, so travel-heavy territories are not mistaken for low productivity.
Can customer complaints be linked to technicians fairly?
Yes. Complaints are linked to the job and technician, but investigated before counting, so issues caused by parts delays or dispatch errors are not unfairly attributed to the technician.
Can quotes raised by technicians be tracked?
Yes. Quotes created on site and their conversion are tracked per technician, recognising those who help customers and grow revenue.
Can safety compliance be part of the scorecard?
Yes. Safety checklist completion and incidents are included, and many businesses require full safety compliance before other incentives apply.